使用球员图像姿势的板球击球分类
磐创AI介绍
姿势检测是计算机视觉 (CV) 技术的子集,可预测人或物体的轨迹和位置。这是通过查看给定人或物体的姿势和方向的组合来完成的。
目标
本文的目的是建立一个模型,该模型可以使用球员的姿势对板球击球进行分类。为此,将图像输入到模型中。它将检测图像中人的姿势,然后使用检测到的姿势,我们将分类它属于什么类型。
目录
1. 安装依赖项
2. 加载和预处理数据
3. 数据增强
4. 使用detectron2检测姿势
5. 使用球员的姿势对板球击球进行分类
6. 评估模型性能
安装 Cricket Shot 分类的依赖项
!pip install pyyaml==5.1
# install detectron2:
!pip install detectron2==0.1.3 -f
https://dl.fbaipublicfiles.com/detectron2/wheels/cu101/torch1.5/index.html
加载和预处理板球击球分类的数据
我们将加载保存在驱动器上的数据集。因此,为此,我们将首先安装驱动器,然后提取简短的 zip 文件。
# mount drive
from google.colab import drive
drive.mount('drive/')
zip 文件包含不同类型镜头的图像。接下来,我们获取文件夹的名称,它们是类别或不同类型的镜头。
# extract files
!unzip 'drive/My Drive/shot.zip'
接下来,我们使用 OS 库的 list ERR 函数来执行此操作。在这里,我们正在打印我们拥有的文件夹名称,我们有四个文件夹,即 pull, cut, drive and sweep.
import os
# specify path
path='shot/'
# list down the folders
folders = os.listdir(path)
print(folders)
输出:['pull', 'cut', 'drive', 'sweep']
接下来,我们正在读取所有图像并将它们存储在一个名为 images 的列表中。我们还将标签存储在一个列表中,该列表是每个图像的类。这个类存储图像的文件夹的名称。我们将遍历每个文件夹并逐个读取图像,并将它们附加到创建的列表中。
# for dealing with images
import cv2
# create lists
images = []
labels = []
# for each folder
for folder in folders:
# list down image names
names=os.listdir(path+folder)
# for each image
for name in names:
# read an image
img=cv2.imread(path+folder+'/'+name)
# append image to list
images.append(img)
# append folder name (type of shot) to list
labels.append(folder)
让我们使用 len 函数快速检查图像的数量。我们可以观察到有 290 张图像。
# number of images
len(images)
输出:290
现在,我们正在可视化数据集中的一些图像。所以对于每种类型的镜头。我们随机绘制五张图像。我们将使用matplotlib来可视化图像。random 函数将用于随机选择图像。
我们将创建一个子图,其中四行代表四个不同的类,五列代表五个示例。接下来对于每个类,我们将随机挑选五张图像并使用 cv2.imread 函数读取图像。读取图像后,你可以将这些图像转换为 RGB 格式并可视化这些图像。
# visualization library
import matplotlib.pyplot as plt
# for randomness
import random
# create subplots with 4 rows and 5 columns
fig, ax = plt.subplots(nrows=4, ncols=5, figsize=(15,15))
# randomly display 5 images for each shot for each folder
for i in range(len(folders)):
# read image names
names=os.listdir(path+folders[i])
# randomly select 5 image names
names= random.sample(names, 5)
# for each image
for j in range(len(names)):
# read an image
img = cv2.imread(path+ folders[i]+ '/' +names[j])
# convert BGR to RGB
img = cv2.cvtColor(img, cv2.COLOR_BGR2RGB)
# display image
ax[i, j].imshow(img)
# set folder name as title
ax[i, j].set_title(folders[i])
# Turn off axis
ax[i, j].axis('off')
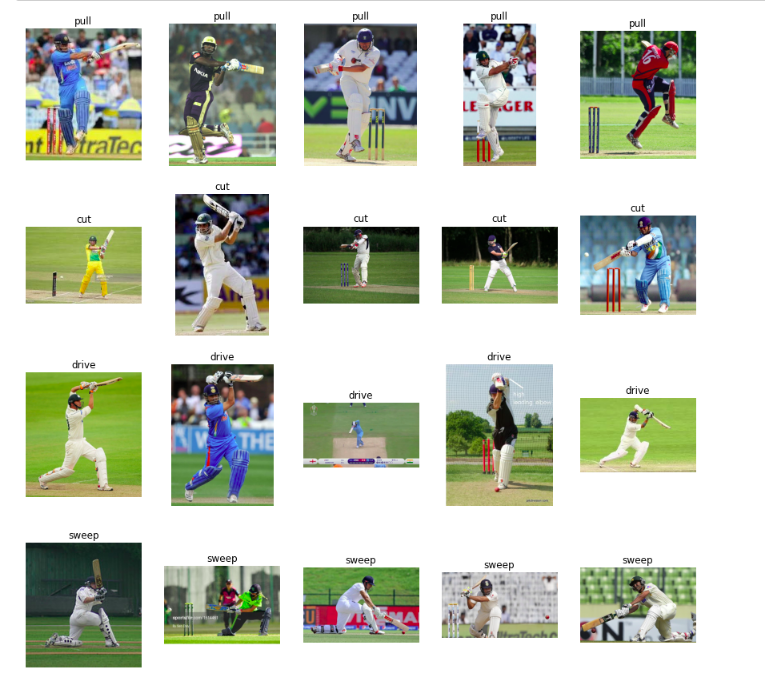
因此,你可以在这里看到我们从数据集中获取的一些图像示例。现在,因为我们在训练集中的图像数量较少。我们将使用数据增强技术来增加我们的训练规模。
数据增强
为了增加我们的训练规模,我们将水平翻转图像,这将有助于我们做两件事,首先,玩家可以同时使用右手和左手,因此通过翻转图像。这将使我们的模型更加通用。它还将增加用于训练的图像数量。
在这里我们创建一个空列表来存储数据集中每个图像的增强图像及其对应的标签。
我们使用 cv2 的 flip 函数翻转它,然后将其附加到列表中。
# image augmentation
aug_images=[]
aug_labels=[]
# for each image in training data
for idx in range(len(images)):
# fetch an image and label
img = images[idx]
label= labels[idx]
# flip an image
img_flip = cv2.flip(img, 1)
# append augmented image to list
aug_images.append(img_flip)
# append label to list
aug_labels.append(label)
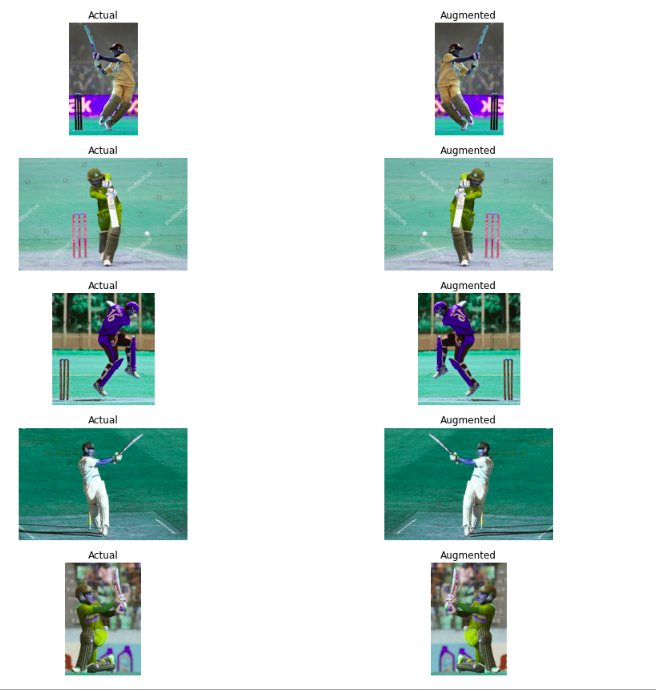
接下来,我们将与原始图像一起可视化一些增强图像。
我们随机挑选了五张图片。此外,我们正在创建一个子图来像以前一样进行可视化。我们首先绘制实际图像,然后绘制其增强版本。
在这里我们可以看到,使用数据增强来翻转图像,镜头的类型不会改变。即使我们水平旋转图像,pull类型的镜头仍属于pull类。
# display actual and augmented image for sample images
# create indices
ind = range(len(aug_images))
# randomly sample indices
ind = random.sample(ind, 5)
# create subplots with 5 rows and 2 columns
fig, ax = plt.subplots(nrows=5, ncols=2, figsize=(15,15))
# for each row
for row in range(5):
# for each column
for col in range(2):
# first column for actual image
if col==0:
# display actual image
ax[row, col].imshow(images[ ind[row] ] )
# set title
ax[row, col].set_title('Actual')
# Turn off axis
ax[row, col].axis('off')
# second column for augmented image
else:
# display augmented image
ax[row, col].imshow(aug_images[ ind[row] ] )
# set title
ax[row, col].set_title('Augmented')
# Turn off axis
ax[row, col].axis('off')
现在我们正在合并实际图像和增强图像并检查图像的数量。
# combine actual and augmented images & labels
images = images + aug_images
labels = labels + aug_labels
# number of images
len(images)
输出:580
使用detectron2检测姿势
现在我们有 580 张图像,包括用于训练的实际图像和增强图像。现在我们的数据集已经准备好了。接下来,我们将使用detectron2 检测所有这些图像中玩家的姿势。
我们将使用detectron2 中的预训练模型来检测这些姿势。我们正在定义模型和一些库,定义我们将使用的模型架构。我们还定义了使用预训练模型的权重的路径。
之后,我们将边界框的阈值定义为 0.8。最后,我们正在定义我们的预测器。现在模型已经准备好了。
# import some common detectron2 utilities
# to obtain pretrained models
from detectron2 import model_zoo
# set up predictor
from detectron2.engine import DefaultPredictor
# set config
from detectron2.config import get_cfg
# define configure instance
cfg = get_cfg()
# get a model specified by relative path under Detectron2’s official configs/ directory.
cfg.merge_from_file(model_zoo.get_config_file
("COCO-Keypoints/keypoint_rcnn_R_101_FPN_3x.yaml"))
# download pretrained model
cfg.MODEL.WEIGHTS = model_zoo.get_checkpoint_url
("COCO-Keypoints/keypoint_rcnn_R_101_FPN_3x.yaml")
# set threshold for this model
cfg.MODEL.ROI_HEADS.SCORE_THRESH_TEST = 0.8
# create predictor
predictor = DefaultPredictor(cfg)
让我们可视化模型中的一些预测。在这里,我们随机挑选五张图像,然后对每张图像进行预测,定义可视化器并在图像上绘制预测。
# for drawing predictions on images
from detectron2.utils.visualizer import Visualizer
# to obtain metadata
from detectron2.data import MetadataCatalog
# to display an image
from google.colab.patches import cv2_imshow
# randomly select images
for img in random.sample(images,5):
# make predictions
outputs = predictor(img)
# use `Visualizer` to draw the predictions on the image.
v = Visualizer(img[:, :, ::-1],
MetadataCatalog.get(cfg.DATASETS.TRAIN[0]), scale=1)
# draw prediction on image
v = v.draw_instance_predictions(outputs["instances"].to("cpu"))
# display image
cv2_imshow(v.get_image()[:, :, ::-1])
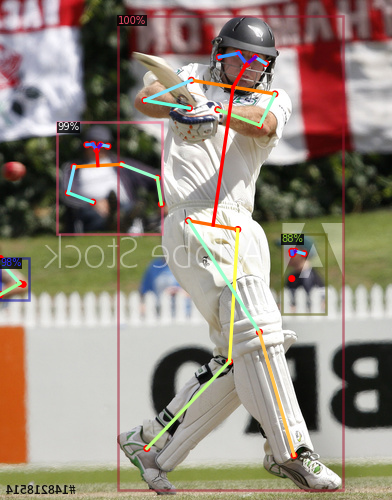
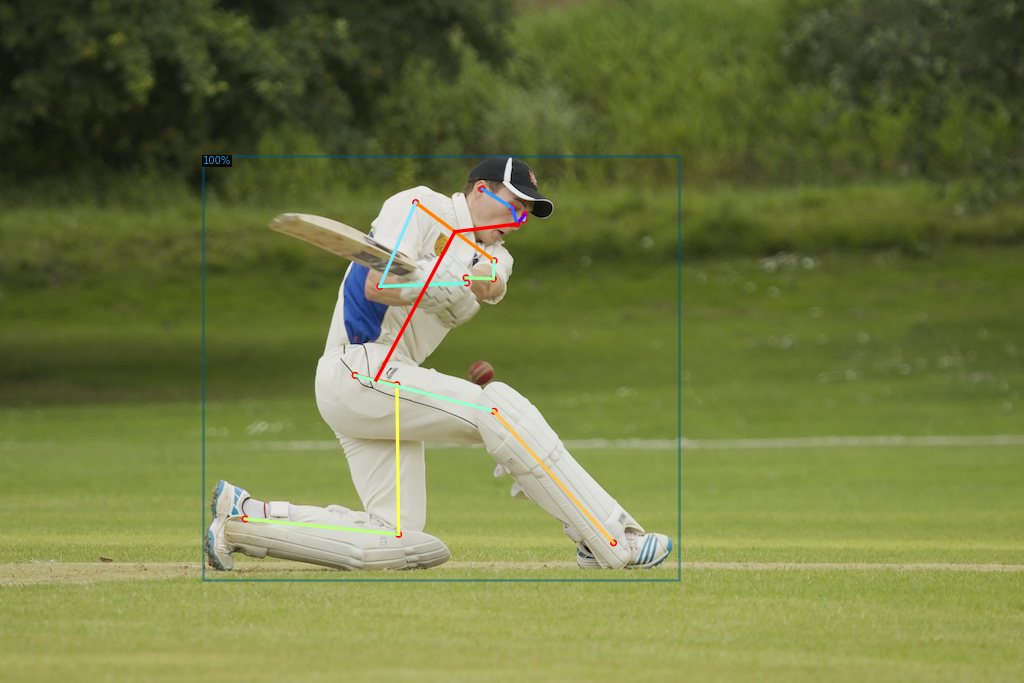
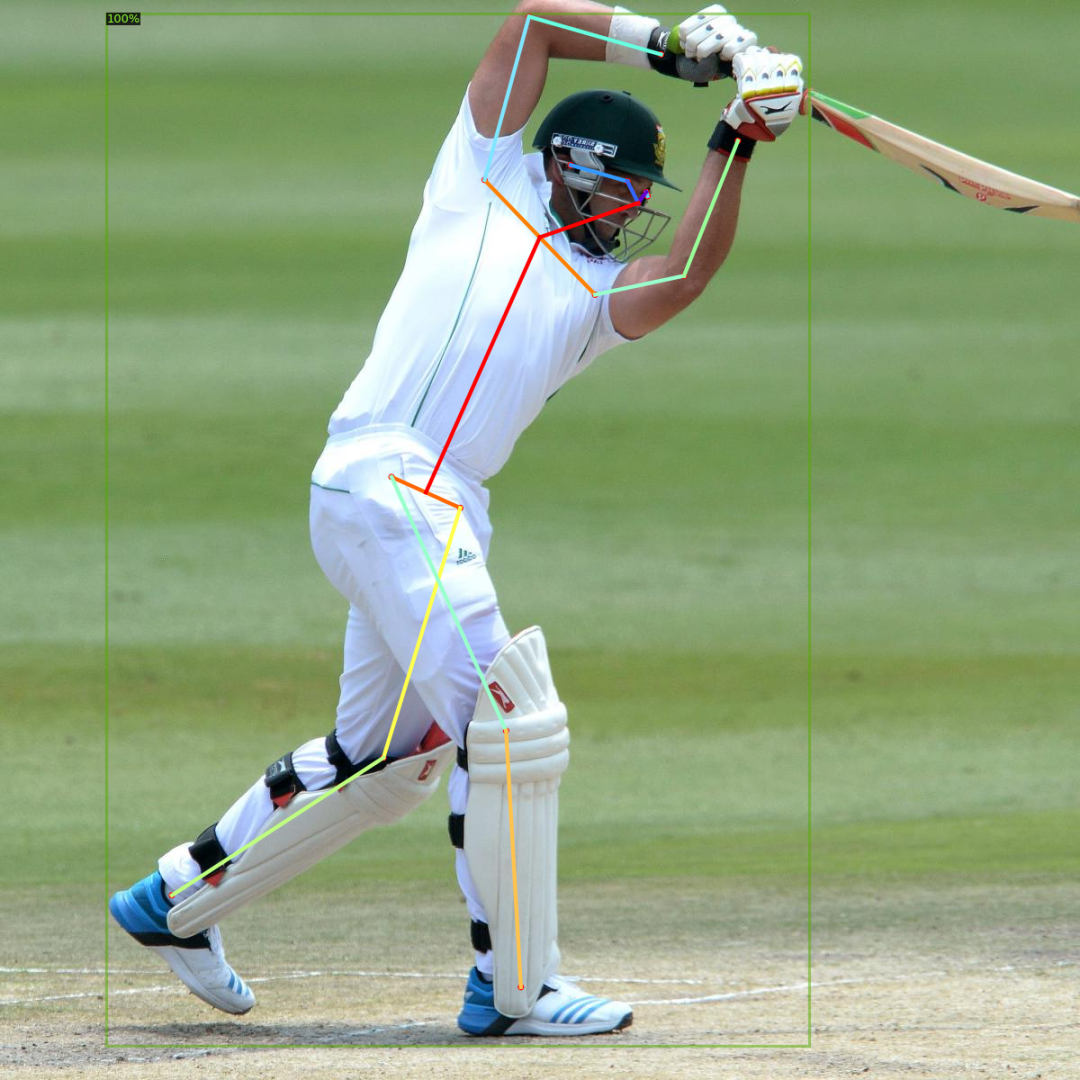
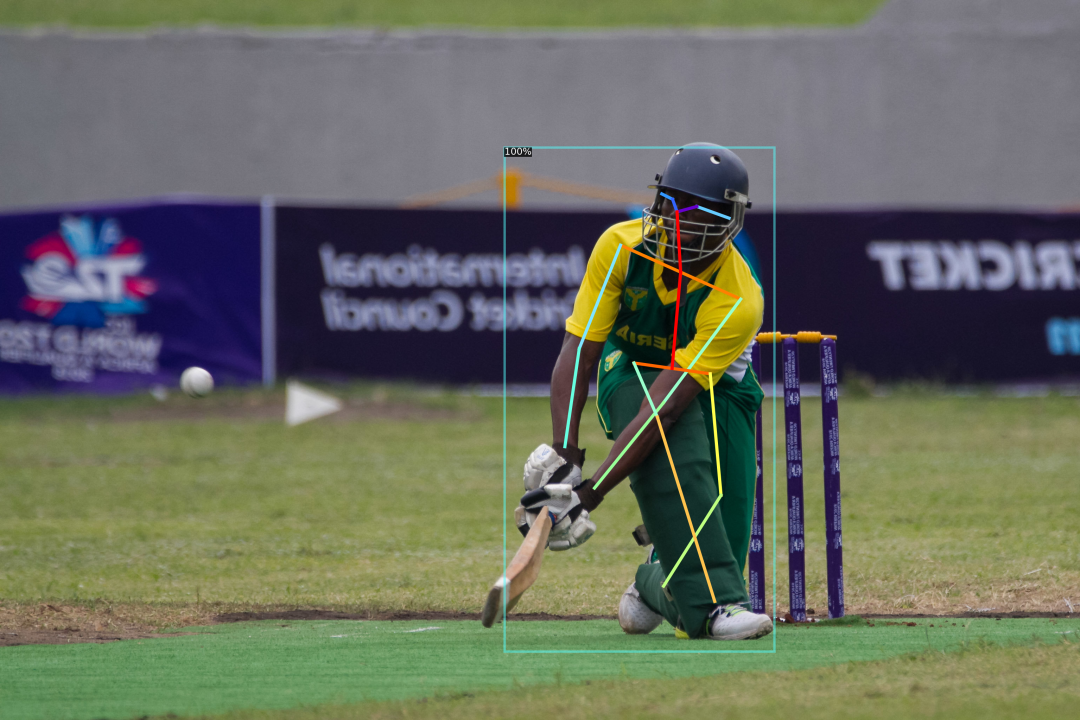
这里是模型的预测。你可以看到我们有边界框以及为每个玩家预测的关键点。你可以看到该模型甚至还预测了背景中的一些图像。这些是模型的一些预测。
接下来,我们将定义一个函数,用于提取和检测图像的姿势。因此,此函数将以图像作为输入,使用预训练模型对图像进行这些预测,然后将提取的关键点转换为单个图像的 numpy 数组。
也可以有多个对象。我们将选择得分最高的对象并只保留那些关键点,最后我们将关键点转换为一维数组。
因为我们希望在此之上建立一个神经网络模型,并且神经网络采用一维输入。
所以在这里我们将其转换为单一维度,现在我们将使用定义的函数,提取所有图像的关键点,并将它们存储在列表关键点中。
现在我们有了所有图像的关键点。接下来,我们将构建一个神经网络,将这些关键点分类为对应的镜头类型。
# define function that extracts the keypoints for an image
def extract_keypoints(img):
# make predictions
outputs = predictor(img)
# fetch keypoints
keypoints = outputs['instances'].pred_keypoints
# convert to numpy array
kp = keypoints.cpu().numpy()
# if keypoints detected
if(len(keypoints)>0):
# fetch keypoints of a person with maximum confidence score
kp = kp[0]
kp = np.delete(kp,2,1)
# convert 2D array to 1D array
kp = kp.flatten()
# return keypoints
return kp
# progress bar
from tqdm import tqdm
import numpy as np
# create list
keypoints = []
# for every image
for i in tqdm(range(len(images))):
# extract keypoints
kp = extract_keypoints(images[i])
# append keypoints
keypoints.append(kp)
5. 使用球员姿势对板球击球进行分类
首先,我们将对关键点的值进行归一化,这最终将加快训练过程。
# for normalization
from sklearn.preprocessing import StandardScaler
# define normalizer
scaler= StandardScaler()
# normalize keypoints
keypoints = scaler.fit_transform(keypoints)
# convert to an array
keypoints = np.array(keypoints)
在这里我们对关键点的值进行了标准化。我们正在使用标签编码将当前为文本形式的目标转换为数字。
# converting the target categories into numbers
from sklearn.preprocessing import LabelEncoder
le = LabelEncoder()
y=le.fit_transform(labels)
之后,我们使用训练测试拆分功能将数据集拆分为训练集和验证集。所以我们将测试大小保持为 0.2,这意味着 80%的数据将用于训练,20%将在验证集中。
# for creating training and validation sets
from sklearn.model_selection import train_test_split
# split keypoints and labels in 80:20
x_tr, x_val, y_tr, y_val = train_test_split(keypoints, y, test_size=0.2, stratify=labels,
random_state=120)
现在为了使用关键点和目标,我们必须将它们转换为张量。因此,在这里我们将关键点和目标转换为 python 张量,用于训练和验证集。
# converting the keypoints and target value to tensor
import torch
x_tr = torch.Tensor(x_tr)
x_val = torch.Tensor(x_val)
y_tr = torch.Tensor(y_tr)
y_tr = y_tr.type(torch.long)
y_val = torch.Tensor(y_val)
y_val = y_val.type(torch.long)
这是训练的形状,验证集有 464 张用于训练的图像和 116 张用于验证的图像。
# shape of training and validation set
(x_tr.shape, y_tr.shape), (x_val.shape, y_val.shape)
现在我们将为我们的模型定义架构。在这里我们从 PyTorch 中导入一些对我们有帮助的函数。在这里,我们定义了一个简单的神经网络架构,其中只有一个具有 64 个神经元的隐藏层。
输出层有四个神经元,因为我们有四个不同的类,输出层的激活函数将返回概率。因此,我们有一个 softmax 激活函数。
# importing libraries for defining the architecture of model
from torch.autograd import Variable
from torch.optim import Adam
from torch.nn import Linear, ReLU, Sequential,
Softmax, CrossEntropyLoss
# defining the model architecture
model = Sequential(Linear(34, 64),
ReLU(),
Linear(64, 4),
Softmax()
)
接下来,我们将优化器定义为 adam,将损失定义为交叉熵。这是一个多类分类问题,然后我们将模型转移到 GPU。
# define optimizer and loss function
optimizer = Adam(model.parameters(), lr=0.01)
criterion = CrossEntropyLoss()
# checking if GPU is available
if torch.cuda.is_available():
model = model.cuda()
criterion = criterion.cuda()
接下来,我们将定义一个用于训练模型的函数。这个函数会将 epoch 的数量作为输入。首先,我们将损失初始化为零,然后使用 Pytorch 变量加载训练和验证集。
将我们的模型和验证转移到 GPU 之后,清除模型参数的梯度。接下来,我们从模型中获取训练集和验证集的预测,并将它们分类为单独的变量。
我们已经计算了训练和验证损失,最后,反向传播梯度并更新参数。
此外,我们还在每 10 个 epoch 后打印验证损失。
def train(epoch):
model.train()
tr_loss = 0
# getting the training set
x_train, y_train = Variable(x_tr), Variable(y_tr)
# getting the validation set
x_valid, y_valid = Variable(x_val), Variable(y_val)
# converting the data into GPU format
if torch.cuda.is_available():
x_train = x_train.cuda()
y_train = y_train.cuda()
x_valid = x_valid.cuda()
y_valid = y_valid.cuda()
# clearing the Gradients of the model parameters
optimizer.zero_grad()
# prediction for training and validation set
output_train = model(x_train)
output_val = model(x_valid)
# computing the training and validation loss
loss_train = criterion(output_train, y_train)
loss_val = criterion(output_val, y_valid)
# computing the updated weights of all the model parameters
loss_train.backward()
optimizer.step()
if epoch%10 == 0:
# printing the validation loss
print('Epoch : ',epoch+1, 't', 'loss :', loss_val.item())
现在我们已经定义了我们的函数。我们将使用此训练功能并开始对我们的模型进行训练。此外,我们正在训练 400 个 epoch。你可以看到该模型每 10 个 epoch 打印一次损失。
最后,我们以 1.38 的损失开始,现在我们最终损失了 0.97。所以我们可以看到,随着模型训练的进行,模型的性能正在提高。
# defining the number of epochs
n_epochs = 100
# training the model
for epoch in range(n_epochs):
train(epoch)
评估模型性能
让我们评估模型性能,以便检查模型的准确性。
从sklearn导入函数。我们得到了包括关键点和目标变量的验证集。一旦获得变量,首先将这些值传输到 GPU,我们将使用经过训练的模型从模型中对验证图像进行预测。
现在我们正在使用 arg max 函数将预测概率转换为相应的类。
# to check the model performance
from sklearn.metrics import accuracy_score
# get validation accuracy
x, y = Variable(x_val), Variable(y_val)
if torch.cuda.is_available():
x_val = x.cuda()
y_val = y.cuda()
pred = model(x_val)
final_pred = np.argmax(pred.cpu().data.numpy(), axis=1)
accuracy_score(y_val.cpu(), final_pred)
最后,我们计算了准确度得分,因此该模型的准确度为 0.79,约为 80%。
结论
为了提高准确性,你可以使用不同的超参数,例如增加模型中的隐藏层数、更改优化器、更改激活函数、增加 epoch 数等等。这就是我们如何建立一个模型来使用球员的姿势对镜头进行分类的教程。
